


I know that Customer Journey Analytics is the buzz in Adobe right now; everyone is thrilled and eager to find out more about Customer Journey Analytics. If you ask me to brief it in simple terms, Adobe Analytics is an analytics platform that features limited data analysis (mostly online) whereas Customer Journey Analytics incorporates both online and offline data analysis that offers an opportunity to seamlessly track the customer journeys with workspace as a reporting interface. People who are working on data schemes and data types on the data engineering front would love to explore the opportunities, but those who use Adobe Analytics primarily to track digital properties and adding business values, kindly do not worry, you have a long way to go. I personally do not think Customer Journey Analytics will even replace standard Adobe Analytics in the next 2-3 years or 5 years with a modest proportion. Do you remember Data Workbench in Adobe Analytics? People using Data Workbench for data analysis would move to Customer Journey Analytics eventually with the advantage of workspace reporting, but not everyone. I didn’t deny the advantages of unlimited variables and events, unlimited unique values, alter historical data, cross-report-suite data, etc., in Customer Journey Analytics but these are not new concepts but merely the existing ones with enhancements. If you are clear with the principles of Adobe Analytics, understanding Customer Journey Analytics is only about understanding the tool features and enhancements, nothing else. So, relax and focus on core concepts!
Coming back to the topic, one of my BnF customers has recently completed their website revamp(redesign) and requested us to conduct a post-revamp analysis to understand the performance/efficiency of the website after the revamp. They were looking for a few relevant KPIs related to revamping, one of which was the Time Spent per Visit on the website. Stakeholders wanted to evaluate the website revamp from the engagement front and hence, Time Spent per Visit on the website was an obvious engagement indicator. Post-revamp analysis indicated that the Time Spent per Visit on the website was lesser(less than 28%) compared to pre-revamp, hence there was a concern among stakeholders. And now, the topic for the day begins! Is the Time Spent, the right metric for understanding the engagement? If yes, why? If no, why not?
As an analyst, I frequently don’t use Time Spent per Visit as an important metric to analyze the performance of a website or a page and this is because the way the metric is computed in Adobe Analytics (Or Google Analytics). This has been debated for a while by modern analytics invaders Snowplow and Acquigo why big analytics platforms such as Google Analytics, Adobe Analytics, Comscore etc., didn’t have a perfect strategy to compute the time spent. So what is the reliable strategy? This could be in your head right now and in sometime I will explain my viewpoint.
Calculation
Total Time Spent is determined on the basis of the amount of seconds elapsed between two server calls (Includes both Page View and Non-Page View server calls). In other words, time spent will never be available for majority of the exit dimensions and the visits with single server call (bounce). And, Time Spent per Visit = Total Time Spent / (Visits – Bounces).
Sample Scenarios
Let us try calculating the Total Time Spent and Time Spent per Visit for the example below to see if the current measurement strategy is reliable.
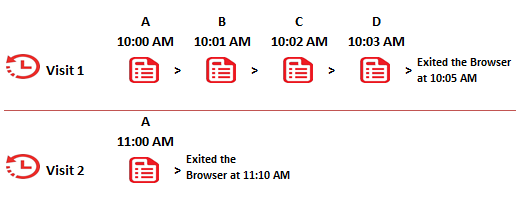
Here, the actual time spent on the website is 300 seconds (60 seconds on page A, 60 seconds on page B, 60 seconds on page C and 120 seconds on page D) for Visit 1 and 600 seconds for Visit 2, total 900 seconds. Time Spent per Visit (Total Time Spent / Visits), would be 450 seconds.
However, Adobe (Or Google) will calculate the same as 180 seconds (60 seconds on page A, 60 seconds on page B, and 60 seconds on page C) against the total time spent which is nowhere near the actual. This is because page D in Visit 1 is an exit page and Visit 2 is a bounce. Even if we calculate Time Spent per Visit (Total Time Spent / (Visits – Bounces)) according to Adobe (Or Google), we would still end up with 180 seconds.
Holding the scenario 1 for now, let’s take another example below.

Here, the actual time spent on the website is 180 seconds (60 seconds on page A, 60 seconds on page B before the user navigates to another tab, and 60 seconds on page C after the user lands on page C), however, Adobe (Or Google) will calculate the same as 600 seconds (60 seconds on page A and 540 seconds on page B). Even if the browser tab is not active, the time spent is computed according to the existing methodology. For Mobile Application, we have a different metric (Total Session Length) which does not include the elapsed time if the application is placed into the background, but the same does not apply to browser inactivity.
Reliable Solutions
I undoubtedly knew that it is not feasible to capture precise values in the digital world, but don’t you think that we must narrow down the gap at the least?
- For scenario 1, Adobe (Or Google) should send pings to its servers at regular time intervals (let’s say 5 seconds or 10 seconds) whenever the user is engaged with the content and the latest ping should be taken into account for computation of the time spent during session closure. I would suggest Adobe not to use the existing beacon types (Page View and Non-Page View) but instead introduce a new beacon type which will not incur cost to the customers i.e. Not to be considered as primary or secondary server calls.
- For scenario 2, Adobe (Or Google) should use Page Visibility APIs to conditionally trigger the pings so that if there is a pause in the pings between the server calls, the pause length can be subtracted from the Total Time Spent.
Conclusion
Coming back to the results of my BnF customer, rather than taking the Time Spent per Visit (Total Time Spent / (Visits – Bounces)), have suggested them to take Time Spent per Page View (Total Time Spent / (Page Views – Exits) and that is for two reasons:
- After revamping the number of pages on the website reduced with more JavaScript navigation such as tabs, sliders, etc.
- Time Spent per Page View (Total Time Spent / (Page Views – Exits) seems more reliable than Time Spent per Visit (Total Time Spent / (Visits – Bounces)). If we try to compute the metric for scenario 1, Time Spent per Page View would be 60 seconds ignoring page D in Visit 1 and page A in Visit 2, which is exact.
Surprisingly the figures looked fantastic with the metric change. Now, don’t you think that Time Spent per Page View is still a better metric to view than Time Spent per Visit?
Related to the reliable solutions, I would leave it to the legends (Adobe and Google) to decide, but if emerging players can do, they can do it for sure. Happy understanding and exploring!