

Every business in the world is trying to understand the effect of Covid-19 on its digital traffic, revenue and growth. Few could directly see the impact and few could not. Two sectors, which could have a perpendicular effect / change in traffic were Banking and e-Commerce. While e-Commerce sectors servicing non-essential items had its direct impact, banking sectors on the other hand receives more traffic due to moratorium and relief related pages across the globe. Improved traffic does not attribute directly to the conversion or potential visitors but might be false-positive to the monthly trend. Thus, most of the sectors on the upper hand might see traffic consistency during the lock down, but I am sure that there will be at least a marginal impact or change in the visitor behavior and pattern.
This post will help Adobe Analytics Architects and Practitioners, who work closely with Banking Sectors to extract, generate and analyze the effects of covid-19. I figured that I should narrow down a few important points for consideration while dealing with banking sectors from my understanding & experience. The post might be confined to the Banking Sector, but the principle should remain valid across the sectors.
Traffic and Conversion Analysis.
The traffic and conversion analysis consists of three steps: 1. Identifying traffic related to moratorium 2. Classifying the customers using segmentation and 3. Excluding the moratorium related traffic from overall traffic.
Step 01: Identifying traffic related to moratorium
- Prepare the list of moratorium related pages: I am sure that all the banking sectors should have list of moratorium pages for their products, FAQs, Opt-In Forms etc. An analyst must identify and list the pages down, it is important.
- Group covid-19 internal search terms: If you are capturing Internal Search Terms, identify and group the list of keywords relevant to moratorium such as Special Relief Fund, Moratorium, Loan Deferment Program, Covid-19 News Update etc.
- Consider anomalies on entries: Visitors / customers might search for product terms to land the product pages, looking for updates on Covid-19 to generate more entries. Segmented numbers resulting out of anomalies could also be helpful.
- Customers count: If you are capturing customer IDs (Hashed), try discovering the customers those appearing on the website for the first time in 2020. The customer IDs identified according to this criteria are more likely to have an intention of moratorium.
- Traffic shift between Website and Mobile Application: Because of covid-19, most of us are Working From Home increasing the probability of website presence together with Mobile Application. Create a Union/Intersection(Venn) diagram to understand the Mobile only, Website only and Combined customer IDs to have the count.
And so on! If you have more options to classify moratorium traffic like the above, add them too.
Step 02: Classifying the customers using segmentation
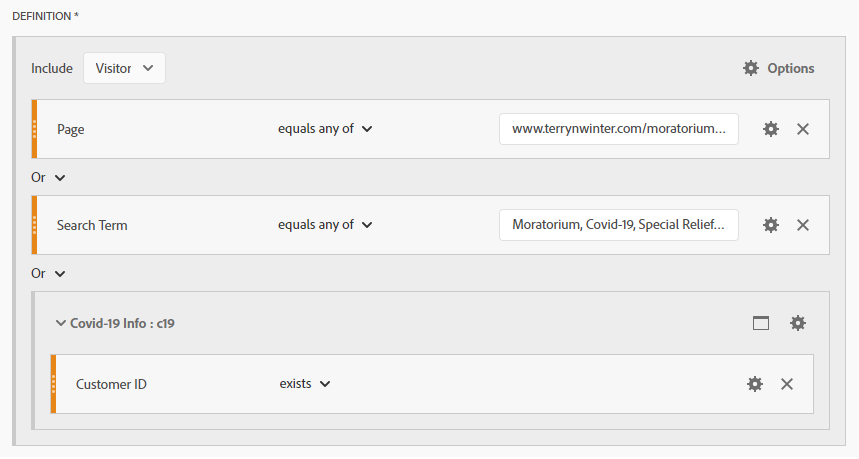
When you have a list of criteria to identify the traffic associated with the moratorium, create Analytics Visitor Segmentation. If you are using Adobe Analytics, click here to view the sample screen grab. You can also build your own segment with other analytical tools.
Step 03: Excluding the Moratorium related traffic from overall traffic.
Finally, exclude the Moratorium related traffic from overall traffic to understand the contribution for the month and the trend over the months. You should be able see some numbers/graph like the below.
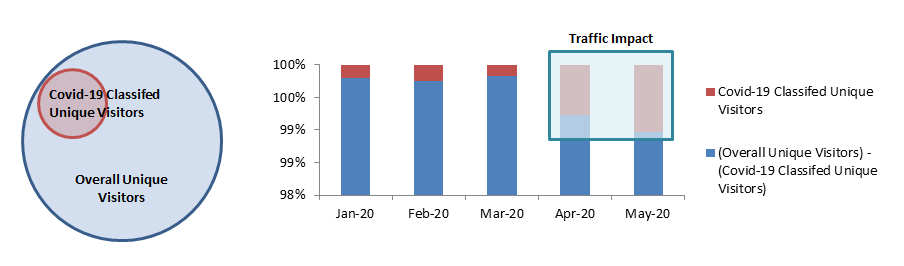
Since the last few months have been open for visitors, the surge / impact will now be seen. Draw a trend chart to assess the real effect of visitors to the conversion i.e. Conversion / Unique Visitors. Now, you will be able to identify the real impact of covid-19. And, it might be positive or negative rarely consistent.
Behavioral Analysis.
If you are unable to see the traffic and conversion impact, look out for the behavioral impact. Below are few constricted points to analyze the behavioral change.
Day and Time Parting: Check out the dimensions of day and time. There should have been some changes in the average traffic or trend before and during covid-19 lock down. A change in the regular pattern should be seen on maximum, minimum, average traffic by hours and days. One of the important change I saw during the analysis was that traffic before lock down will reach it’s maximum during Tuesday & Wednesday and will be minimum during the weekend but during the lock down the traffic was consistent from Monday till Saturday and only Sunday’s traffic was minimal compared to other days.
Geo-segmentation: Interestingly, the geo locations reports like Zip, Area, Region were great while the lock down was being carried out. The input now should be genuiner because the IP address showing the office locations and during travel is omitted at the lock-down.
Traffic shift between Website and Mobile Application: Shift in usage between Website and Mobile Application will also help us to understand the customer behavior on usage and accessibility. The shifted usage might inform us that customers are potential for the shift between platforms to target across multiple devices.
Devices Contribution: It is not just the shift of website and mobile application that can provide further insights, but also the shift from laptop access to mobile / tablet access. Customers who login to mobile phones might claim that they still choose mobile devices and not any other devices i.e. Targeting these customers through SMS will be the best mode of option rather than the any other channel right?
Marketing Channels / Source Of Traffic: Obviously yes! No big paid promotions and thus the annulment factor on total conversion will not be seen. Let me explain! Assume that average conversion rate on Organic Channels were 12% and Paid Channels were 4% before lock down nullifying the total conversion rate to 8%. On the absence of paid contribution, the total conversion rate should ideally increase. If you still see consistent or declined conversion rate during the lock down, the company has already been affected by covid-19.
Stopping myself here especially when you hate creating enormous blog posts. Analysis didn’t have boundaries and thus endless. While banking sectors are looking for device contribution, Telecommunication Sectors might look for carrier name, Insurance Companies might look for some other attribute and so on.
I hope the post gave you an hint to start with, constrict and focus. Enjoy doing the analysis but continue to monitor the behavior and pattern since lock down did end for most of the countries. See you in next post!
Adobe Analytics segment builder screen grab: