Flow Analysis or Flow Visualization is an important visualization in Workspace that provides us with a comprehensive information of visitor navigation. Although most people use this visualization, not everyone has the profound understanding. Most of them don’t understand the difference between Path Views and Page Views or how Flow Visualization works in Workspace with added settings like Flow Container (Visit & Visitor) and Flow Options (Include Repeating Instances) selection. If you would like to have a detailed understanding on how the Flow Visualization works in workspace, I would recommend that you spend at the least 10-15 minutes in the post. Sadly, it is difficult to wrap the subject in 3-5 minutes, so if you are busy, bookmark the page and pursue the topic later.
Metric: Most people have an understanding that Flow Analysis operates with Page Views or Visits or Unique Visitors metric, but that is not right. The only metric used by Workspace Flow Visualization is Instances! So in this case, Path Views = Instances, nothing else. If you didn’t know what is an Instance, kindly refer this link before continuing the post. In short, Instances refer the number of times a given variable was defined in any Server Call (Including Page View & Non-Page View Server Calls and does not include persisted values).
Flow Container (Visit & Visitor): So what is visit or visitor here? These are not the metrics used in Workspace Flow Visualization rather is how Adobe Analytics connect two Server Calls for Pathing. If we use Visit, only the Server Calls within a visit will be connected together and for Visitor, Server Calls for the unique visitor will be connected together ignoring the visit boundary. Example scenario will help us to understand these containers in detail.
Flow Options (Include Repeating Instances): By default if consecutive Server Calls have same value for the variable only the first value will be accounted for the Workspace Flow Visualization and the rest will be discarded. If we want to include the repeating value for the variable, we need to toggle this flow option.
Let’s get into the action and attempt to build Workspace Flow Visualization for the below scenario. I am sure that we will have better understanding on Workspace Flow Visualization by the end of this article.
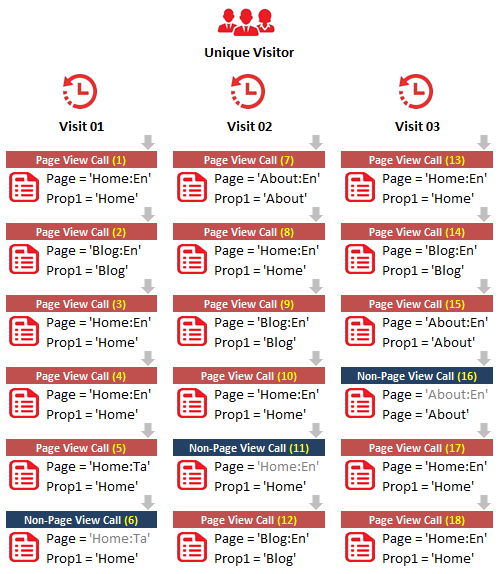
To describe the scenario, the yellow highlighted numbers are the Server Calls in succession across three visits and for the single unique visitor. Red ones are the Page View Server Calls and blue ones are the Non-Page View Server Calls. For the given scenario, let’s build Flow Visualization for both Page and Prop1 variable.
The reason I want to build the Workspace Flow Visualization both for Page and a Prop is because Page variable cannot be set in a Non-Page View Server Call and thus behaves differently than any other variable. Again, we will focus only on ‘Home:En’ for Page and ‘Home’ for Prop1 rather than focusing every dimensional value. In all respects, below are the metrics for the dimensional values we will address throughout the topic.

Grey highlighted numbers refer to the Server Calls i.e. Same as yellow highlighted numbers in the scenario above.
Flow Visualization : Page (Home:En)
Exclude Repeating Instances (Default)
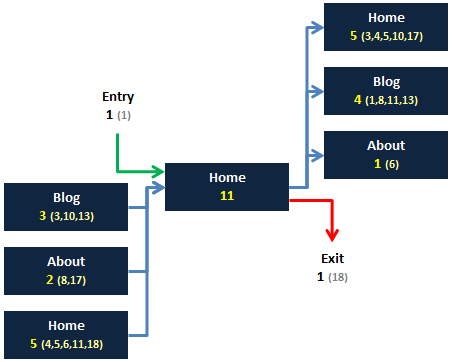
For Page variable, if we need to remove the repeating instances, it can only be the reloads. So, ignoring the Server Calls 4 and 18, below is the flow diagram for both the visit and visitor containers. Although Server Call 11 has Page variable it will also be ignored because Page variable cannot be accounted for a Non-Page View Server Call as said earlier.
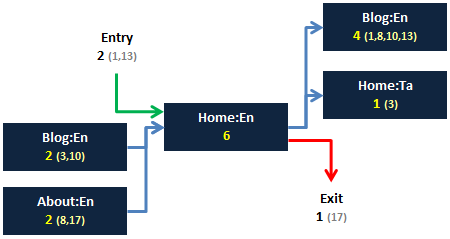
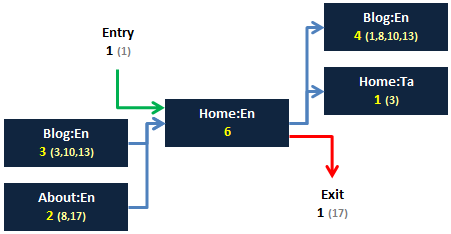
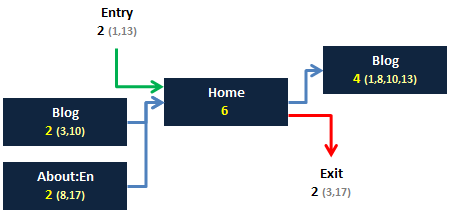
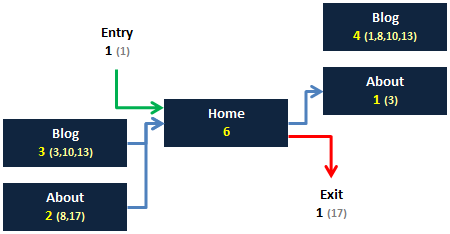
Ignoring the repeating instances (Reloads), the instances for ‘Home:En’ is 6. This is same for both visit and visitor container, however for visit, the previous association for the Server Call 13 will be just an Entry and for visitor, it will be Server Call 12 i.e. Blog:En. Also, if you have a dimensional value at your last Server Call of a visit and have the same dimensional value in the first call of next visit, both the Server Calls will be included for the Visit container and the second Server Call will be excluded for a Visitor container. Because, for a visit, both the Server Calls are independent and for visitor, the second Server Call is a repeating instance. So, when you toggle between visit or visitor container for Non Repeating Instances, the selected dimensional instance will change.
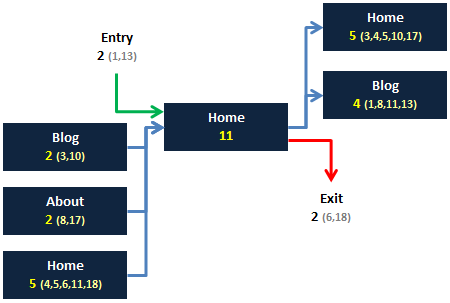
I have added Server Call numbers to the blocks to help you quickly identify the previous and next page values. Values 3,10 inside the ‘Blog:En’ of previous page block refers that the Server Calls 3 and 10 of ‘Home:En’ has the previous Server Call value ‘Blog:En’ (Refer visit container). Values 1,8,10,13 inside the ‘Blog:En’ of next page block refers that the Server Calls 1, 8, 10 and 13 of ‘Home:En’ has the next Server Call value ‘Blog:En’ (Refer visit container again). If there are no previous and next Server Calls for the page, it will be referred as entries and exits respectively based on visit or visitor.
Include Repeating Instances
Only difference from the previous visualization is that now the visualization include repeat instances i.e. Server Calls 4 and 18 (Reloads). Again, Server Call 11 will be ignored because Page variable cannot be accounted for a Non-Page View Server Call.
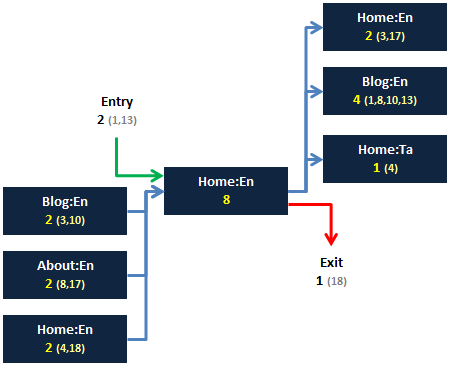
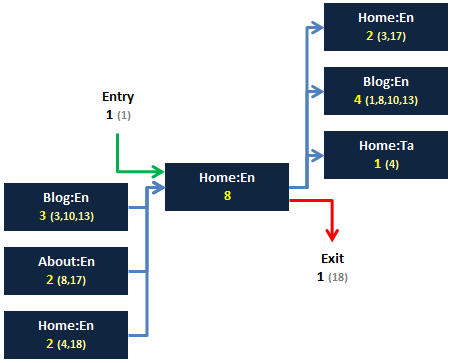
Since because we include all the Server Calls here, Visit and Visitor container toggle will not have any impact to the selected dimensional instance i.e. We never remove any repeating instances here.
Flow Visualization : Prop1 (Home)
Exclude Repeating Instances (Default)
For Prop1 variable, we need to remove all the repeating instances not only reloads, so Server Call 4, 5, 6, 11 and 18 will be ignored (11-5=6 Instances). And since Prop1 can be set in a Non-Page View Server Call we need to account all the Server Calls irrespective of whether it is a Page View or Non-Page View. Considering the #s, below is the flow diagram for both the visit and visitor container.
Include Repeating Instances
Only difference from the previous visualization is that now the visualization include repeat instances i.e. Server Calls 4, 5, 6, 11 and 18.
Conclusion
In short, if we have an absolute understanding on Instances metric, Flow Visualization in Workspace is simple. Below are few more important notes:
– For Pages, Non Repeating Instances is equal to the subtraction of Page Views and Reloads (Non Repeating Instances = Page Views – Reloads) but not the same for all other variables, so kindly do not attempt to tally the numbers.
– Workspace Flow Visualization works with the same methodology for eVars and not only Props i.e. All dimensions.
– Visitor allocation in Workspace Flow Visualization is based on the Time Period selection.
– Flow Reports (Next & Previous) in Reports & Analytics Interface works only with Visit container and Non Repeating Instances. Other options are not available!
Also, I can understand that scrolling the page up and down to refer scenarios and flow visualization is tougher for everyone so click here for side-by-side visuals (Can zoom). For easier understanding, I have removed the repeating Server Call instances in visuals for Non-repeating Flow Visualization builds.
Hope now you got clear understanding on how Flow Visualization works and if you feel the post is helpful, would love to see your comments. See you in next post!




Thanks for the detailed explanation arun
Even it is easy for a beginner to understand with the help of easy language & the well written words helps in conceptual understanding.
Thanks for making it clear & understandable!