The term ‘Content Velocity’ (Earlier, Page Velocity) is often used by modern marketers for more than 3 years now and therefore is not unfamiliar to the digital platform. Businesses are concentrating on ways to increase Content Velocity and thus, Adobe. Adobe already established the framework to increase the content velocity of their business units with its rich stacks. While the integrated stacks such as Adobe Experience Manager (AEM), Adobe Campaign, Advertising Cloud and Digital Assets Management (DAM) are specifically designed to deliver the tailored or high-value content to the visitors, Adobe Analytics on the other hand focuses on the integration results.
So how is Adobe Analytics measuring Content Velocity? What is Content Velocity in a clear and understandable context in Adobe Analytics? This is the subject for you, if you are interested to know.
Definitions / Quotes
Search Engine Journal says “Content Velocity is measuring the amount of content a brand is putting out during a defined period of time”.
Connection Model says “Content Velocity is the measure of how much content a brand puts out over a particular period”.
All these pleasant and enticing definitions are interesting for overall understanding, but is it enough for measuring Content Velocity in Adobe Analytics? If not, do we need to wait for the definition from Adobe?
Adobe says “Content Velocity is a calculated metric template that helps you measure how impactful a dimension is on downstream content. It uses the formula Page views (Visit participation) divided by Visits”.
Good or uncertain right now? You’re with me, if it is uncertain.
What is Content Velocity?
From a measurable instance I would define Content Velocity as “the average number of contents that a visitor consumes in a visit after viewing a specific content i.e. downstream”. Or if we assume content as a page then Content Velocity (Here, Page Velocity) is “the average pages viewed by a visitor in a visit after viewing a specific page i.e. downstream”.
Content Velocity calculation in Adobe Analytics
Calculating traditional ‘Page views per Visit’ or ‘Page views per Visitor’ is not complex, however, how do we calculate the impact of a dimension is on downstream content or page? Let us look at an example in the following section and compute Content Velocity for the pages listed.

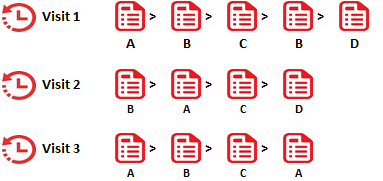
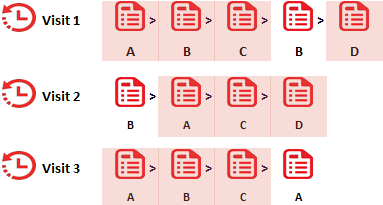
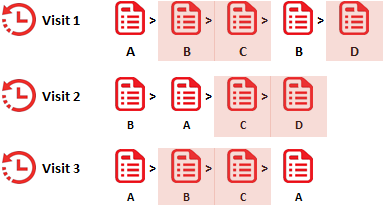
If we calculate the pages viewed by a visitor in a visit after viewing page A; there are 4 pages (A,B,C,D) for visit 1, 3 pages (A,C,D) for visit 2 and 3 pages (A,B,C) for visit 3, therefore the average is (4+3+3)/3 = 3.33 [Sum of pages viewed / Visits]. Note that the calculation includes the starting page (Here, page A).

If we decide to exclude the starting page (Here, page A), then the calculation can be ((4+3+3)-3)/3 = 2.33 [(Sum of pages viewed – Visits) / Visits].

Either way, we can measure how impactful a dimension is on downstream content and thus the Content Velocity calculation on the pages look like the below.

Adobe’s metric on Content Velocity is based on the Page Velocity including the starting page, thus the calculation is based on Page views (Visit participation) divided by Visits. It is necessary to use Page views (Visit participation) because we need to count the pages and not the page views. Participation deduplicates the dimensions that are seen multiple times and thus it helps us to match the expectation. For more information on the attribution models, click on the link here.

Thus the metric ‘Content Velocity’ is different & opposed to the traditional ‘Page Views per Visit’ and gives us a hint on how much of our web content is being consumed by the visitors in a visit impacting the downstream. More the Content Velocity, more is the impact the content or dimension is producing on the downstream navigation. Cheers!


